
4 Numbers That Predict Where Your Dental Practice Is Headed

The average general dental practice produces just under $1 million a year, according to the ADA Health Policy Institute. As a dental marketing company, Patient NEWS works with practices that are successful and focused on growth. Their average production is over $2 million. That 2X gap tends to raise one question: how many more new patients does it take to get there?
New-patient flow plays a pivotal role in practice success and growth, but usually, you need fewer than you might think. Our clients generate 40% more new patients than the industry average. For many offices, that means adding just two to three additional new patients a week. Most practices can absorb that without adding overhead, so it drops revenue almost straight to profit. New patients can be hard to win and expensive to lose, and many practices are quietly leaking the ones they already paid to acquire. These growth levers could be sitting in your database right now.
Below are four numbers that can help you take action in your practice. I'll add what our clients look like on each, and what high performers do differently. You can pull all four from Practice ZEBRA, our dental marketing software, or dig them out of your practice management software. Maybe I'm biased, but I recommend you take a look at Practice ZEBRA's dashboard. If you're not connected, we'll connect you for free. Your Account Manager is always available to walk you through the data and what you can do to shift gears on any of these metrics.
Schedule time to connect here.
1. Your active patient count and the trend behind it.
The industry benchmark for a full-time, single-dentist practice runs about 1,500 to 1,800 active patients. Our clients' average is over 2,100, and super practices average 6,000. What matters more than the number is the direction it is moving. Production that holds steady while the active count slips means you are earning more from fewer people. That is a strong-looking quarter often built on a shrinking foundation.
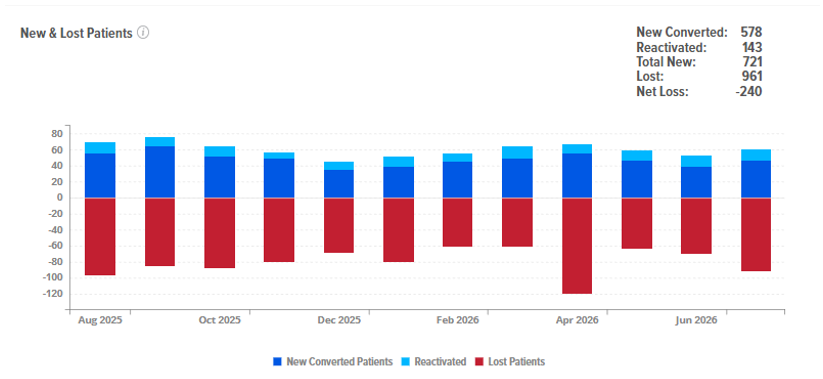
Nothing is ever linear. You want to track your net gain and loss and watch the trend – that is the honest signal. “I didn't realize we could see our patients broken down like this,” is what we hear when clients check out this report. Below is an example of what you don’t want to see: a net loss of 240 patients, even though the practice is cranking on new and reactivated patients.
Do this: Pull your active patient count, then look at it across the last 12 to 24 months. If the line is drifting down, push your acquisition campaigns (to outstrip what attrition is doing to you) and review what your recall system should be catching. (And always check out Practice ZEBRA.)
2. The one in five who are halfway out the door.
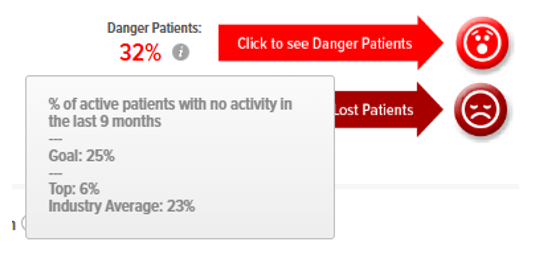
Inside that active base is a group that has not had a completed visit for nine to 24 months … and they have nothing on the books. Practice ZEBRA flags them as danger patients. Across our client base, danger patients average about 20% of the active list. On a 2,100-patient practice, that is roughly 420 people.
For context, the average practice loses about 17% of its patients each year, according to Dental Economics. The top 10% lose closer to 3%. Winning a patient back costs a fraction of acquiring a new one – a point every retention study in dentistry keeps making.
“I didn't realize we had hundreds of active patients who haven't been in for months.”
You will not recover all 420. Nobody does. But this is the warmest list in your building, because every name on it has already chosen you once. Working it costs a few phone calls and some texts.
Do this: Pull your danger or dormant list. The cheapest new patient is often one you already have. Sort them by value and cross-reference with your unaccepted treatment list. You'll be able to home in on a targeted reactivation campaign with solid production waiting in the wings.
3. How your phone actually sounds.
This one is about conversion and lost opportunity. If you track and score your calls, you already know your conversion rate and the reasons calls don’t book. That is the data, and it is worth having, but it is not the whole picture.
Here is what the scoreboard misses. A score tells you whether a call booked an appointment. Our scoring in Practice ZEBRA also gives you several data points, including the primary reasons callers don't book. It's amazing. What it doesn't tell you, however, is how the caller felt. Many dentists assume the front desk has it handled, right up until they listen to a recording and hear a prospective patient being made to feel unwelcome with a flat, “We're not in network with your insurance.” The real issue is that the response assumes the patient's choice of provider comes down to insurance and cost. It misses the chance to dig deeper by asking what prompted the call, and explaining that the practice accepts new patients, files claims, and helps patients maximize their benefits. The practice may offer exactly what matters most to that caller: convenient hours, location, experience, technology, or quality of care. But the call ends before any of that is explored. The difference between a caller who feels welcomed and one who feels processed never shows up in a booked-or-not column.
If you're like our clients who say, “I'm interested to see where our call opportunities are being lost, and how we can improve conversion,” try the suggestion below.
Do this: Every month or so, sit down and listen to five to 10 real calls yourself, booked and not booked. You are not auditing anyone – you’re listening for tone and objection handling, because tone and skill are what turn a first call into a first visit. You're also listening for coaching and scripting opportunities that help your team convert more new patients.
4. The new patients who never show up or never come back.
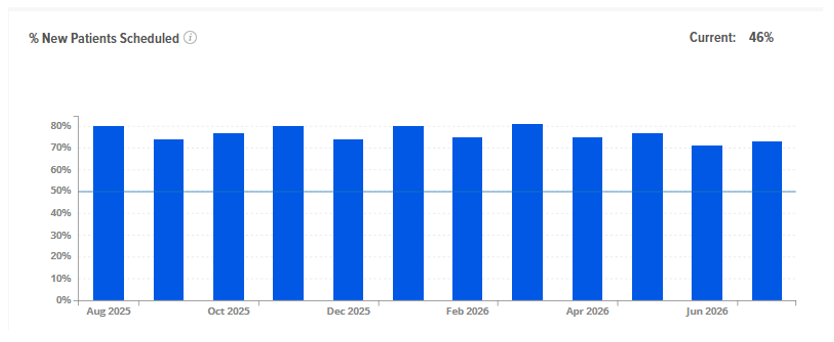
Getting the phone to ring is only half the job. In Practice ZEBRA, we look at “new not converted” versus “converted” and “new not scheduled.”
Here is a “not converted” August snapshot from a real office in Practice ZEBRA. In ZEBRA, you can click through and see the list of patients for easy follow-up and rescheduling.
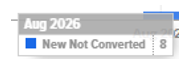
Now, is this team contacting those eight patients and making sure they're booked for September? Not yet, for this specific practice. What’s your process for not converted new patients? And what’s the practice's average new patient value? $1,438. Those eight new patients, left behind in August, represent about $11,500. Worth a few calls to follow up and nurture? You bet.
Once a new patient is in, our clients book an average of 40% of them for a second visit. Across the industry, only about 41% of new patients ever return after that first visit, a figure attributed to the ADA and widely repeated throughout the profession. Nearly six in 10 don't come back.
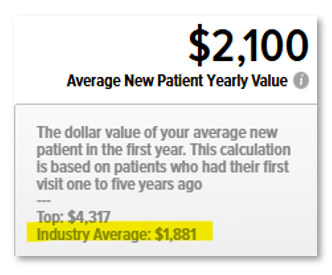
“I didn't realize we were losing track of so many potential new patients.” And, “I didn't realize these patients represented that much value.” Do you know the value a new patient contributes in the first year at your practice? Across our clients, it averages just under $2,000.
Practice ZEBRA gives you the leading indicator for this: the percentage of new patients who have their next appointment already booked. Again, it comes with a quick, downloadable report, so you can add those patients to a follow-up cadence right away instead of letting them float until a reactivation campaign kicks in nine months later. When 60% of new patients don't get scheduled to come back, the question is why. Scheduling the next visit is the clearest early sign of whether a new patient becomes a real one.
It’s tempting to assume the ones who don't return were one-time patients who were never worth much, the emergency visit or the second opinion just passing through. Some are. But the research points somewhere less comfortable: most first-visit dropouts trace to experience and follow-up, not to patient value.
Do this: Pull your non-scheduled new patients, sort by value and unaccepted treatment, and get them into a follow-up cadence. You won those patients once. They should be coming back and referring their friends and family.
The pattern
Active count and its trend, danger patients, and second-visit scheduling are all about keeping what you already have. The other one – the phone – decides whether the patients you pay to attract ever make it through the door.
Growth almost always gets framed as an acquisition problem. And honestly, it often is an acquisition problem when awareness marketing isn’t a big part of the acquisition program for the practice. New patients are the lifeblood of growth. Meanwhile, you can start with these four numbers and act on the two that surprise you most.
If you would rather skip the spreadsheet archaeology, Practice ZEBRA puts all four on one screen and benchmarks them against the industry and top performers. Click here to schedule a meeting to review your numbers.
Share:

Stay In The Know!
Join 20,000 dental colleagues today!
Subscribe to our weekly updates, and/or request a free brochure and product samples.